Overview
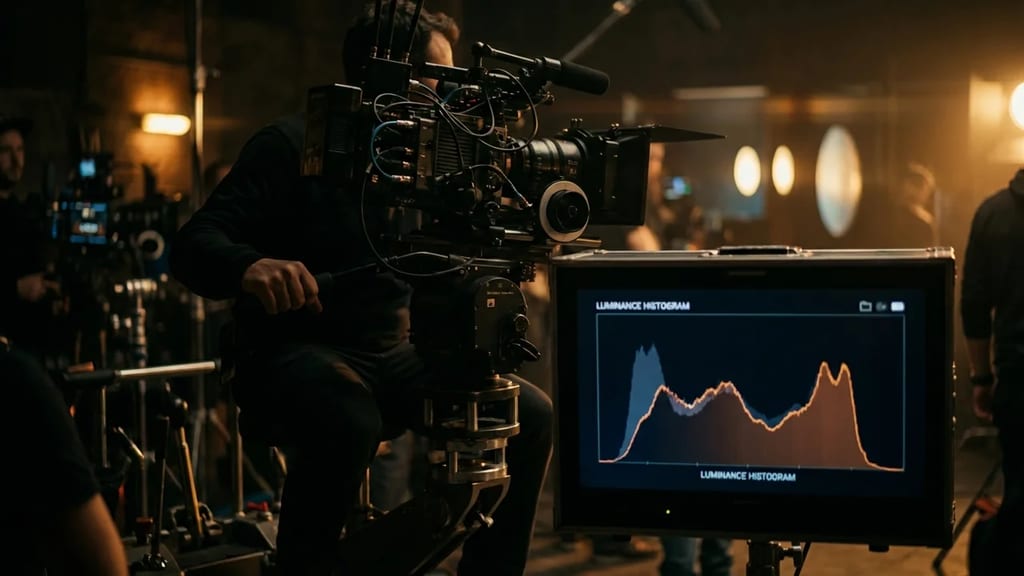
The histogram is an exposure tool that displays the distribution of brightness values in an image as a bar chart. The horizontal axis ranges from shadows (left) through midtones to highlights (right), and the vertical axis shows how many pixels correspond to each brightness value. This allows you to see at a glance whether an image is underexposed, balanced, or overexposed.
Unlike purely visual assessment via the camera display or monitor, the histogram is independent of ambient light and display calibration. It is therefore an objective reference for exposure in on-set image composition. Histograms are now available in virtually all photo and video cameras, as well as in editing software (e.g., as part of Lumetri Scopes in Adobe Premiere Pro).
Luminance and RGB Histogram
Typically, two display modes are distinguished, which can usually be switched on the camera:
- Luminance Histogram: displays the brightness distribution across all color channels, without considering the color itself. A bright orange and a bright blue can have the same luminance value.
- RGB Histogram: displays the Red, Green, and Blue channels separately. It makes visible when an individual color channel is already reaching its limit (e.g., a saturated red is clipping), even though the luminance histogram may still appear uncritical.
Clipping and Tonal Range Limits
The edges of the histogram mark the limits of the representable tonal range. If values accumulate at the left edge, the shadows are clipping (underexposure/clipping in the blacks), and detail in the dark areas is lost. If values accumulate at the right edge, the highlights are blowing out (overexposure/clipping in the highlights) and cannot be recovered in post-production. A balanced histogram utilizes the available tonal range without hard clipping at either end – although the ideal distribution always depends on the subject and the desired image effect.
On-Set Use
In practice, cinematographers use the histogram along with other exposure aids such as zebras and waveform monitors, especially in difficult lighting conditions (backlight, stage lighting, mixed lighting), to ensure correct exposure. The histogram answers the question of how much – i.e., how the brightness values are distributed. However, it does not show where in the image these values are located. For this purpose, the waveform monitor is the preferred tool, as it assigns brightness to the image section column by column, making overexposed areas spatially locatable. Both tools therefore complement each other on set.